Comparing Metro & Non-Metro Areas
Jaewon R. Choi
In this document, we will dive deeper in examining potential difference between metro and non-metro area in the state of Texas when it comes to broadband’s influence in entrepreneurship. In order to conduct such analyses, we use the Rural-Urban Continuum Codes (RUCC, 2013) and its distinction of metro and non-metro areas.
Overall, we will take the following strategies in constructing models for analyses
- Include the metro/non-metro variable as a categorical predictor
- Investigate the cetegorical predictor’s interaction with broadband variables in their effects on entrepreneurship variables
- Filter the dataset based on the metro/non-metro categorical variable and conduct separate regression analyses
- Examine how the models differ from each other
We will first import packages and dataset.
####################################
### Metro & Non-metro Comparison ###
####################################

library(tidyverse)
library(ggplot2)
library(gridExtra)
library(car)
library(psych)
library(jtools)
library(interactions)
library(sandwich)
library(sjPlot)
library(sjmisc)
library(stargazer)

## Import dataset ##
bb_entrepreneur <- read.csv("https://raw.githubusercontent.com/texastipi/broadband_entrepreneurship/master/Broadband-Entrepreneurship-TXKSME.csv")
bb_entrepreneur <- bb_entrepreneur %>%
  mutate(pct_fixed_acs_2018 = pct_fixed_acs_2018/100,
         pct_self_employed_2019 = pct_self_employed_2019/100,
         metro_f = as.factor(metro_f))   # Change to percentage
Subset and Inspect Variables
Here we will subset the dataset to include only Texas counties. Also we will only select the variables that will be included in the following regression analyses. The variables that will be included in the analyses are outlined in the regression models page in detail.
## Inspecting variables of interest ##
tx_bb_subset <- bb_entrepreneur %>%
  filter(ST == "TX") %>%
  select(pct_bb_fcc_2019, pct_broadband_MS, pct_broadband_mlab, pct_fixed_acs_2018, # Broadband
         IRR2010, RUCC_2013, metro_desc, metro_f, # Metro-nonmetro
         pct_nonfarm_bea_2018, venturedensity_mean, pct_chg_bea_2012_2018, # Entrepreneurship
         pctagriculture_2019, pctconstruction_2019, pctwholesale_2019, pctretail_2019, pcttransportation_2019, pctinformation_2019, # Control
         pctfinance_2019, pctprofessional_2019, pctedu_healthcare_social_2019, pctother_occupation_2019, pctpublic_admin_2019, pct_self_employed_2019, pctlessthanhigh_2019, pctbachelors_2019,
         pctgraduate_2019, pctmilennial_2019, pctgenx_2019, pctboomers_2019)
Using boxplots, we will inspect the relationships between the metro/non-metro factor and our major dependent and independent variables.
## Warning: Removed 3 rows containing non-finite values (stat_boxplot).## Warning: Removed 2 rows containing non-finite values (stat_boxplot).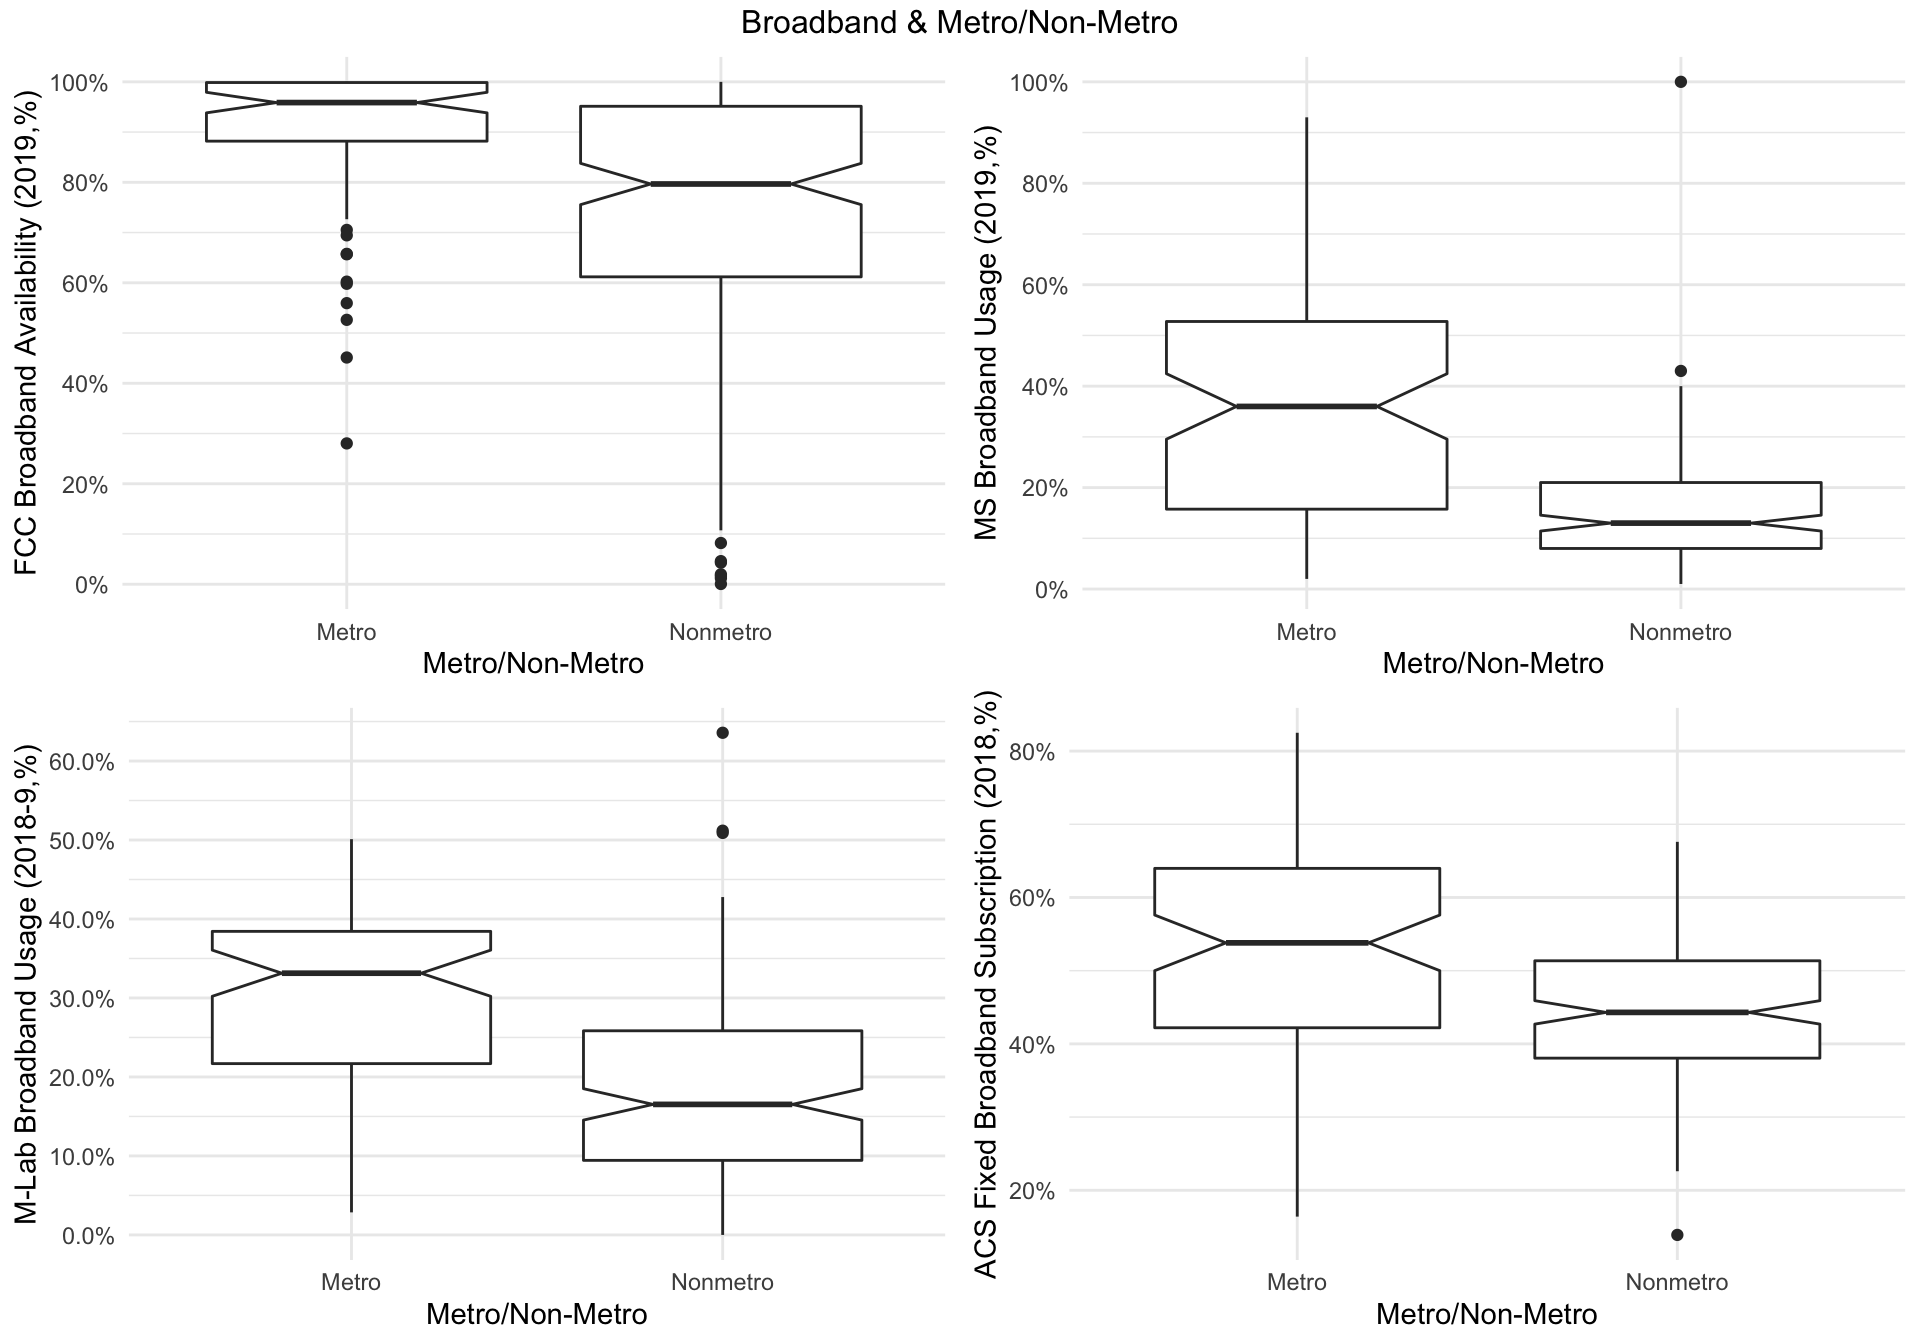
## Warning: Removed 1 rows containing non-finite values (stat_boxplot).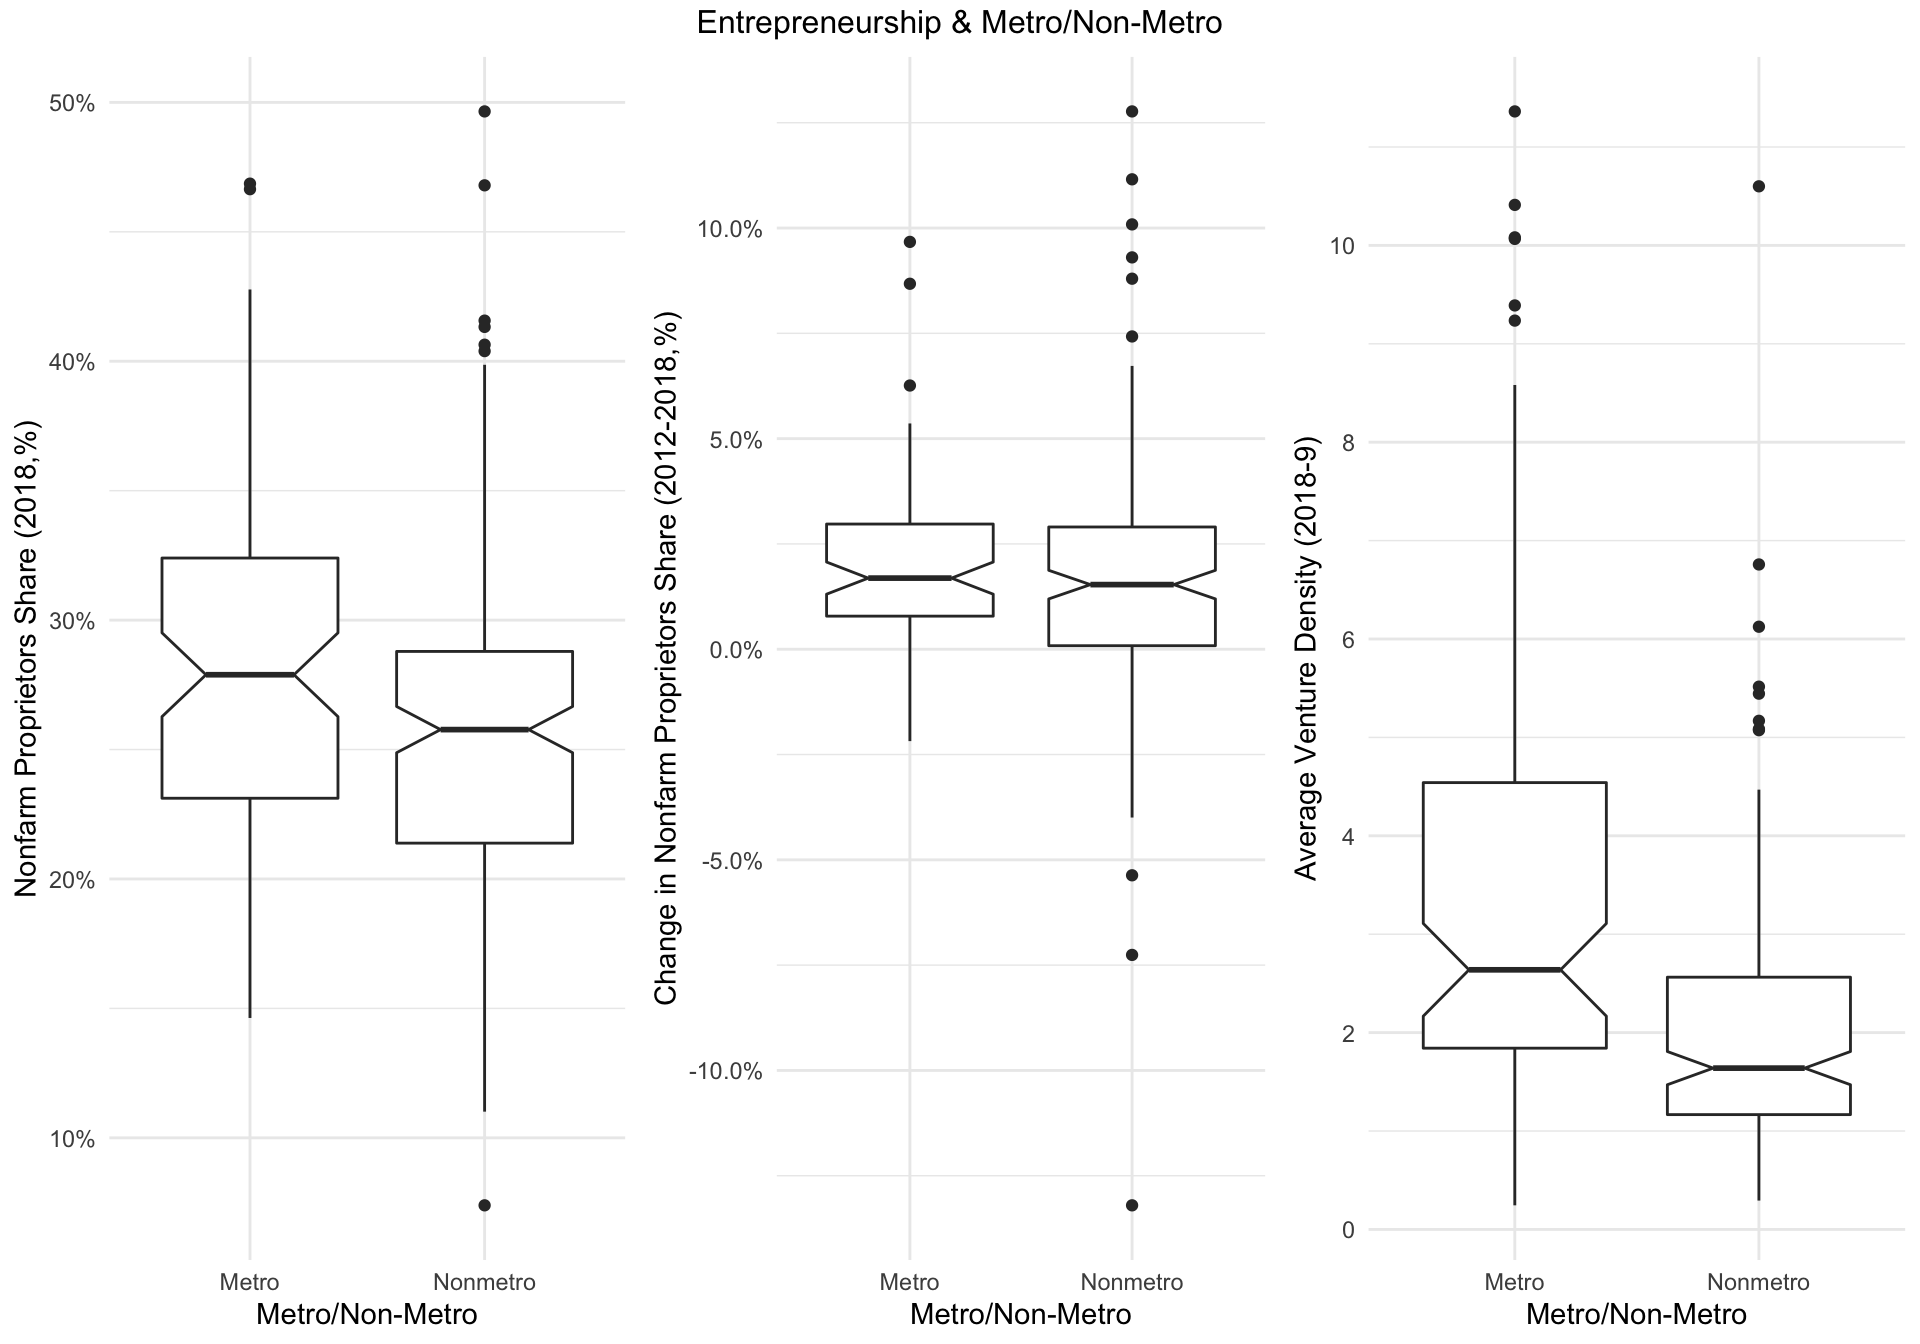
Metro/Non-Metro as a Categorical Predictor
In this section, we will analyze the effect of metro and non-metro area distinction to the relationship between broadband and entreprneurship. In other words, how do the relationship between broadband and entrepreneurship influenced by whether certain county is considered metro or non-metro area? First, we address this question by including such distinction as a predictor variable in the models analyzing the relationships between broadband and entrepreneurship.
Furthermore, results of extended models investigating the interaction effect between broadband measures and metro/non-metro factor will be reported as well. These interaction terms will allow us to better understand how potential broadband’s influence in entrepreneurship vary according to the county’s rurality.
Venture Density
- DV: Venture Density (Average of 2018-9)
- Independent Variables
- FCC Broadband Availability (2019, %)
- Microsoft Broadband Usage (2019, %)
- ACS Fixed Broadband Subscription (2018, %)
- M-Lab Broadband Usage (2018-9, %)
- Metro/Non-Metro
- Control Variables
- Industry Structure
- Education
- Age groups
| Dependent variable: | ||
| Venture Density | ||
| (1) | (2) | |
| FCC Broadband Availability (%,2019) | 0.084 | 0.378 |
| (0.359) | (1.015) | |
| MS Broadband Usage (%,2019) | 2.086* | 5.603*** |
| (1.107) | (1.745) | |
| ACS Broadband Subscription (% of population with fixed broadband subscription, 2018) | 0.271 | -1.400 |
| (1.064) | (1.997) | |
| M-Lab Broadband Use (% of testers with 25/3 Mbps speed, 2018-9) | -0.606 | -5.398*** |
| (0.944) | (2.020) | |
| Metro/Non-Metro (Reference: Metro) | 0.363 | -0.547 |
| (0.225) | (1.113) | |
| Agriculture (% of workers) | -1.314 | -1.934 |
| (1.738) | (1.755) | |
| Construction (% of workers) | 7.068** | 6.294* |
| (3.206) | (3.195) | |
| Wholesale (% of workers) | -4.556 | -3.102 |
| (7.667) | (7.622) | |
| Retail (% of workers) | -1.057 | -1.301 |
| (3.255) | (3.241) | |
| Transportation (% of workers) | 1.074 | 0.169 |
| (3.756) | (3.741) | |
| IT (% of workers) | 28.542** | 27.447** |
| (11.707) | (12.028) | |
| Finance (% of workers) | 7.592 | 5.888 |
| (5.936) | (5.943) | |
| Professional (% of workers) | 8.380* | 8.502* |
| (4.402) | (4.419) | |
| Education, healthcare, social (% of workers) | -0.522 | -0.744 |
| (2.295) | (2.286) | |
| Other occupation (% of workers) | -8.803* | -10.149** |
| (5.063) | (5.090) | |
| Public sector (% of workers) | -1.526 | -2.225 |
| (2.943) | (2.972) | |
| Self-employed (%) | 2.803 | 3.694 |
| (3.220) | (3.244) | |
| Education Less than Highschool (%) | 3.721** | 4.035** |
| (1.617) | (1.615) | |
| Bachelors Degree (%) | 16.710*** | 16.120*** |
| (3.362) | (3.361) | |
| Graduate Degree (%) | 5.513 | 4.886 |
| (4.703) | (4.690) | |
| Babyboomer | 14.591*** | 15.187*** |
| (3.896) | (3.912) | |
| GenX | 24.881*** | 24.361*** |
| (4.625) | (4.611) | |
| Millenials | 4.385 | 4.931 |
| (3.280) | (3.294) | |
| FCC x Metro | -0.314 | |
| (1.080) | ||
| MS x Metro | -5.293** | |
| (2.127) | ||
| ACS x Metro | 2.005 | |
| (2.218) | ||
| M-Lab x Metro | 6.100*** | |
| (2.238) | ||
| Constant | -12.869*** | -11.833*** |
| (2.734) | (2.929) | |
| Observations | 248 | 248 |
| R2 | 0.679 | 0.691 |
| Adjusted R2 | 0.646 | 0.653 |
| Residual Std. Error | 1.155 (df = 224) | 1.144 (df = 220) |
| F Statistic | 20.619*** (df = 23; 224) | 18.236*** (df = 27; 220) |
| Note: | p<0.1; p<0.05; p<0.01 | |
Interaction Charts
The results indicate quite significant main effects of Microsoft’s broadband usage and M-Lab’s broadband usage data as well as their interaction effects with rurality of counties reflected by metro/non-metro distinction. Below we will generate charts for each interaction effects to better make sense of their influences.
Interaction Effect of MS Broadband Usage and Rurality on Venture Density
## Generate Plot ##
plot_model(model_vd_int, type = "pred", terms = c("pct_broadband_MS","metro_f"),
           title = "Interaction Effects of MS Broadband & Metro/Non-Metro on Venture Density",
           axis.title = c("MS Broadband Usage (%)","Venture Density"),
           legend.title = "Metro/Non-Metro")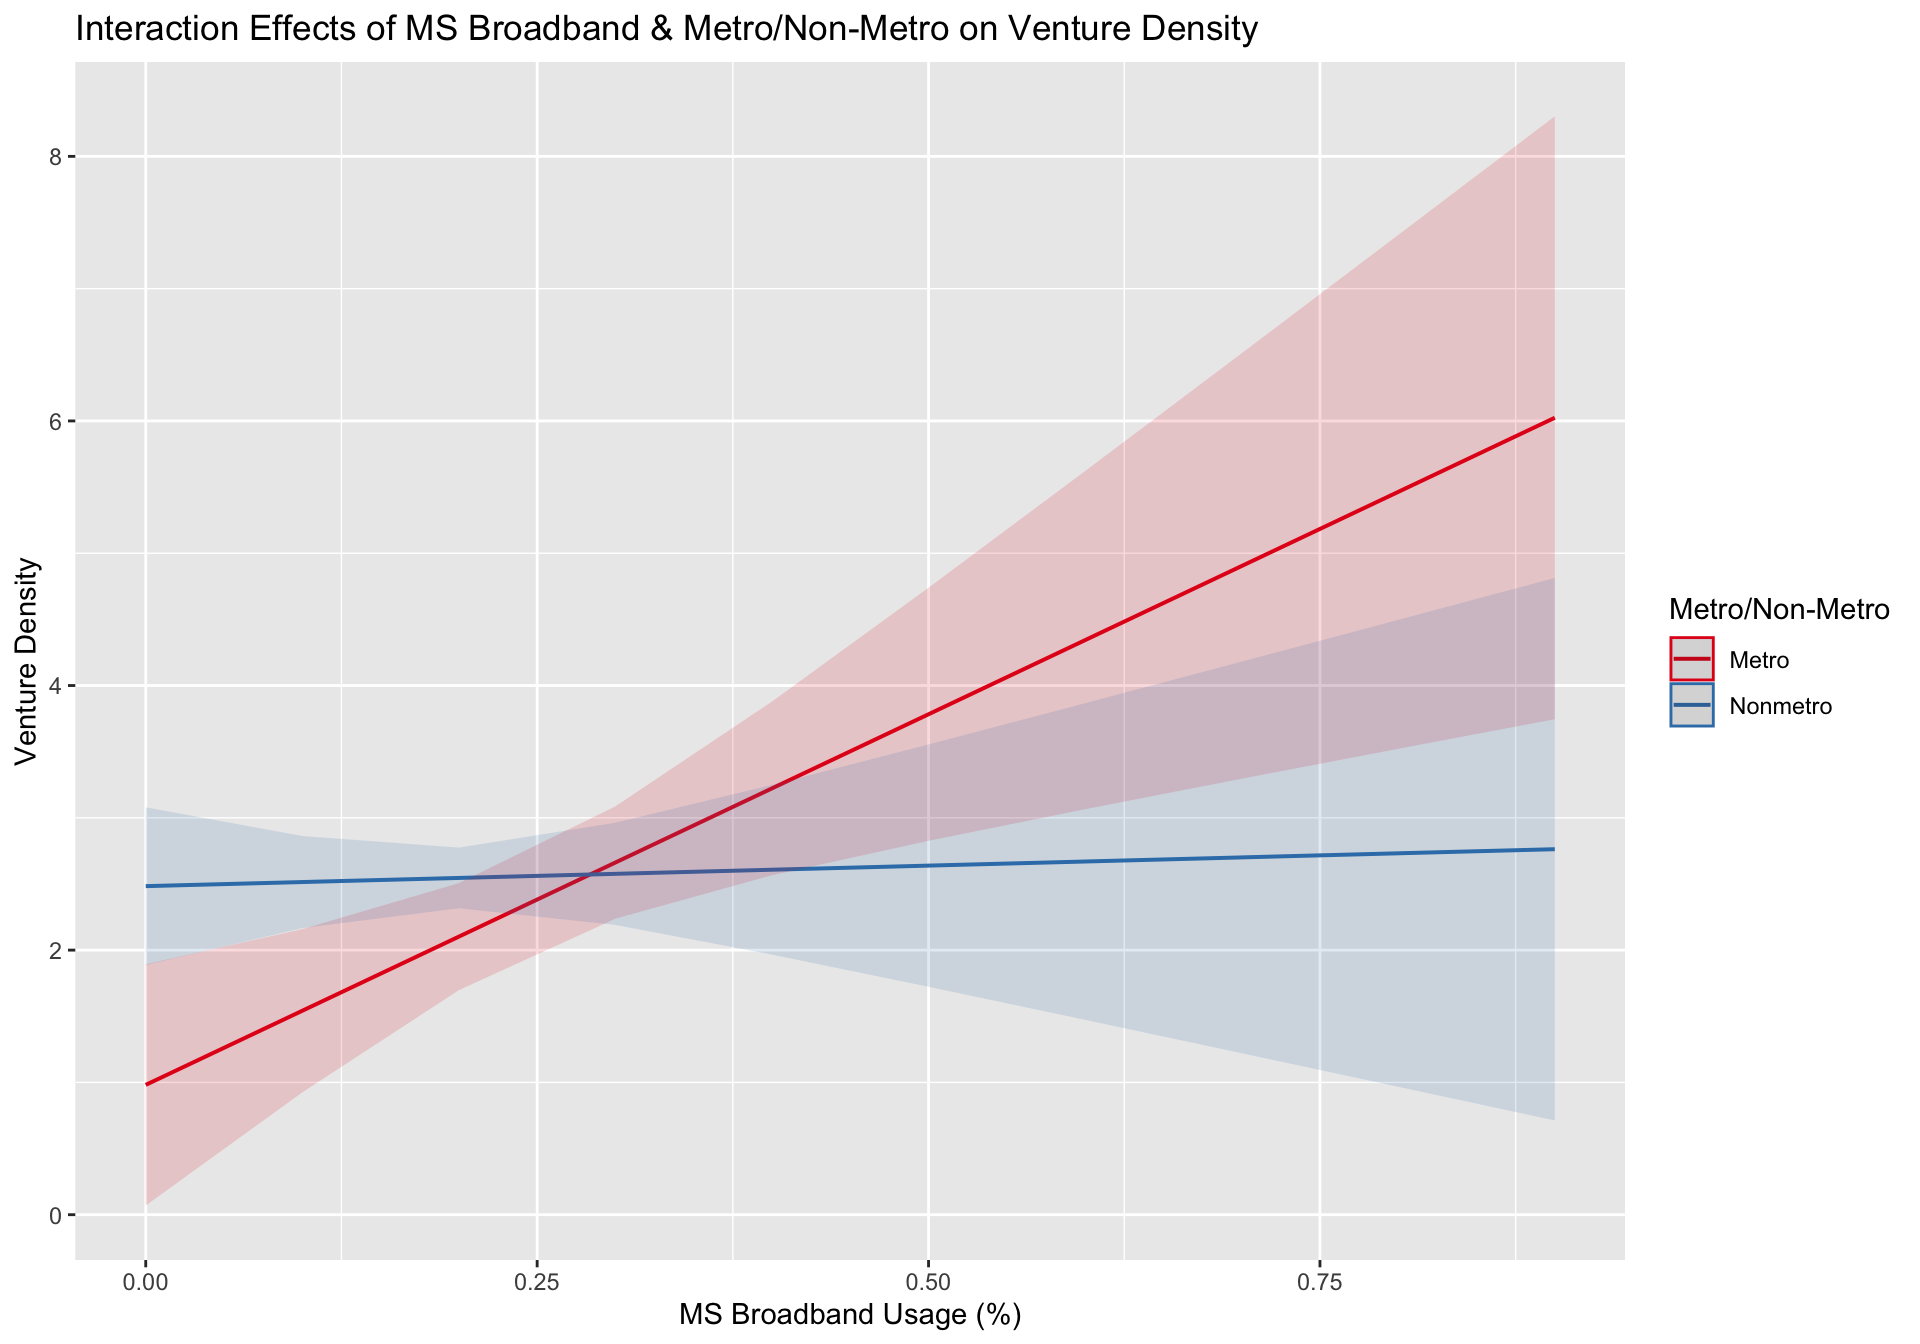
## Generate Plot ##
plot_model(model_vd_int, type = "pred", terms = c("pct_broadband_mlab","metro_f"),
           title = "Interaction Effects of M-Lab Broadband & Metro/Non-Metro on Venture Density",
           axis.title = c("M-Lab Broadband Usage (%)","Venture Density"),
           legend.title = "Metro/Non-Metro")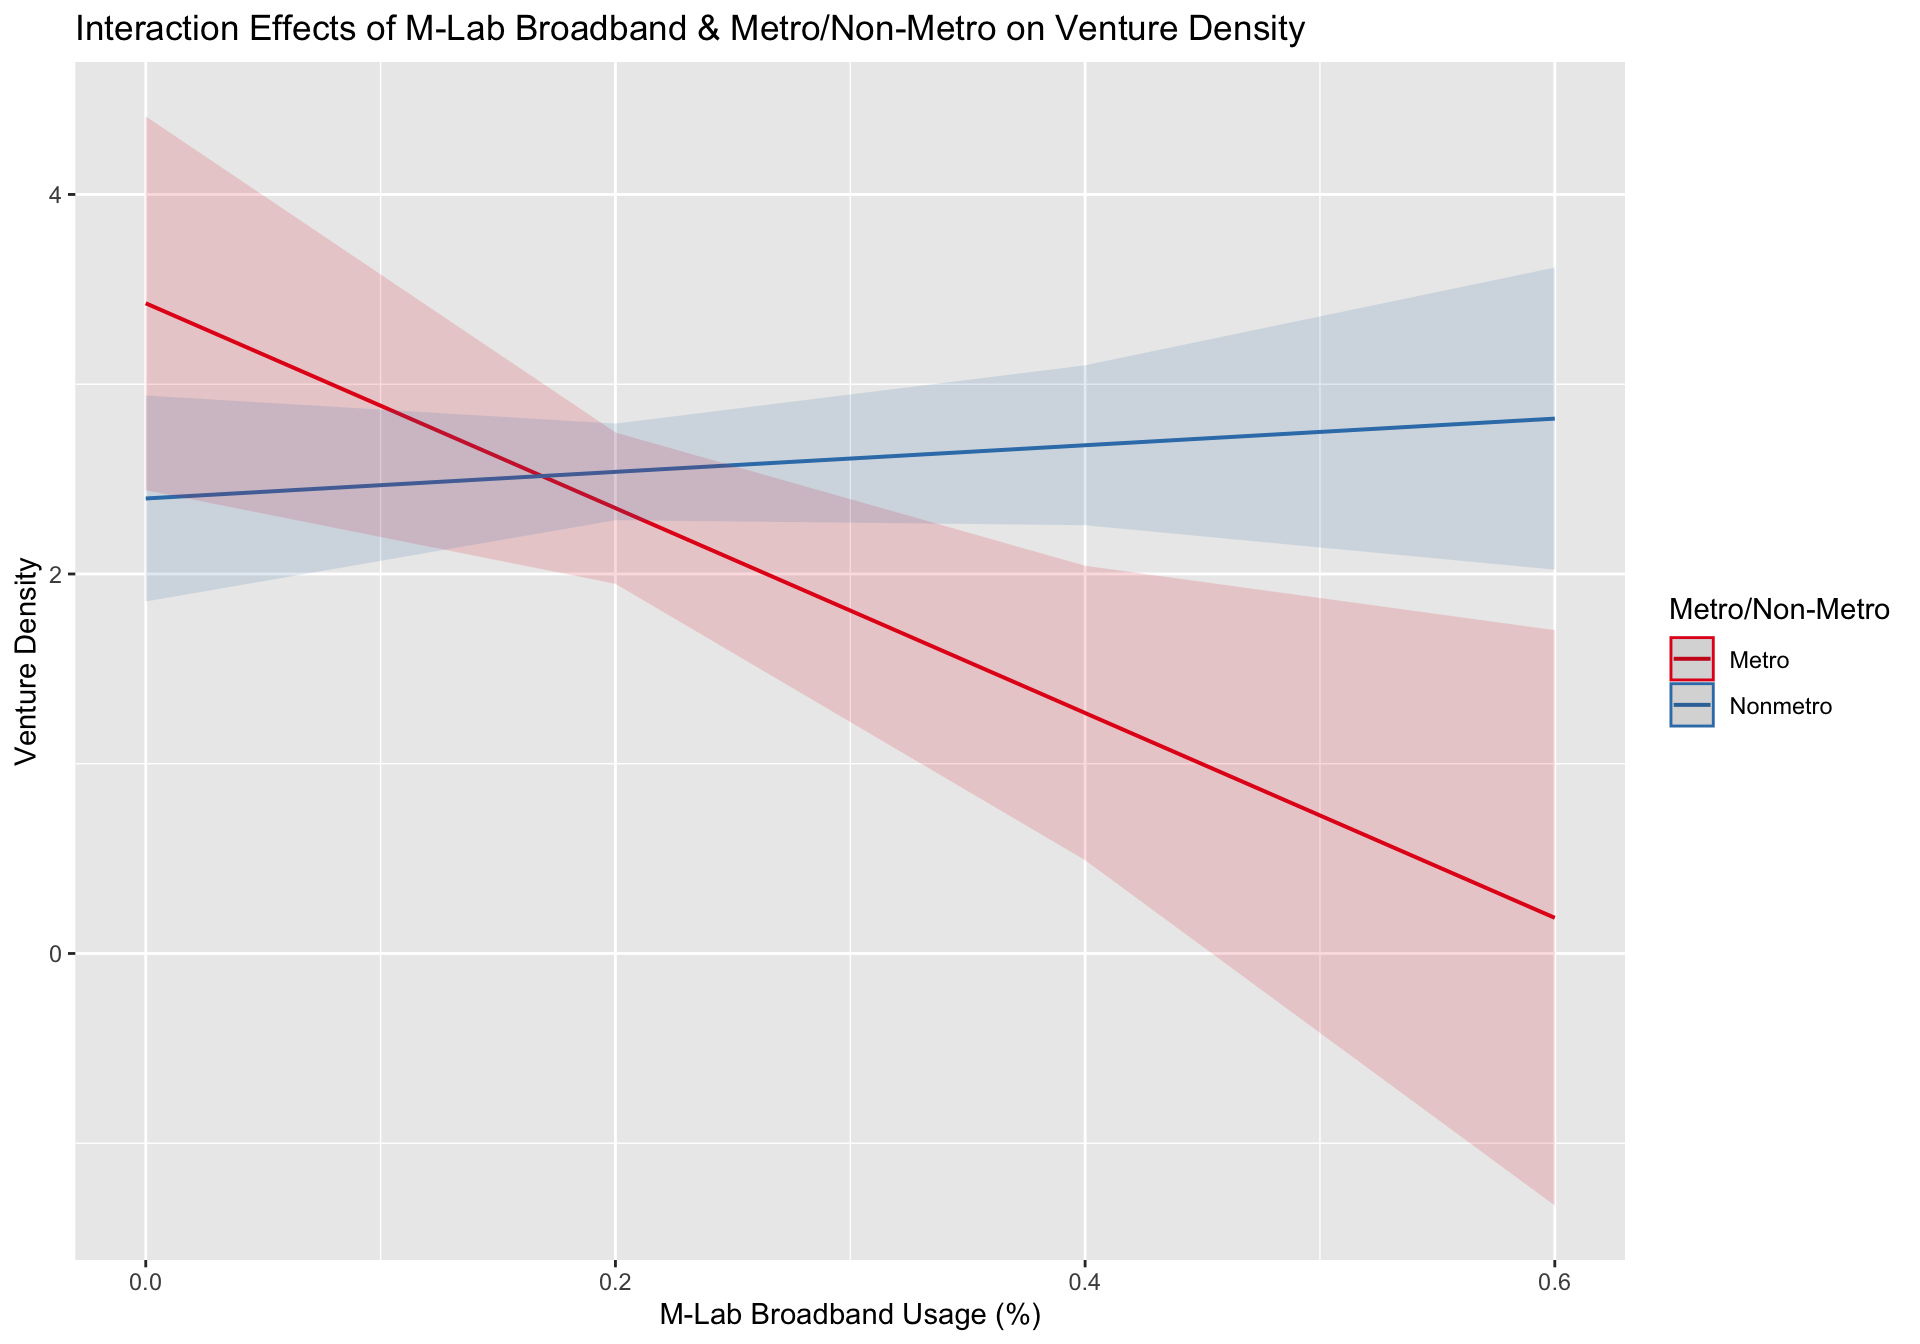
Separate Models for Metro & Non-metro Counties
In this section, we will investigate how the variables analyzed throughout the regression models play different roles for metro and non-metro counties separately. We will filter the dataset by the metro/non-metro category, and run the regression models and compare.
## Filter metro/non-metro ##
metro_tx <- tx_bb_subset %>% filter(metro_f == "Metro")
nonmetro_tx <- tx_bb_subset %>% filter(metro_f == "Nonmetro")Venture Density
- DV: Venture Density (Average of 2018-9)
- Independent Variables
- FCC Broadband Availability (2019, %)
- Microsoft Broadband Usage (2019, %)
- ACS Fixed Broadband Subscription (2018, %)
- M-Lab Broadband Usage (2018-9, %)
- Control Variables
- Industry Structure
- Education
- Age groups
| Dependent variable: | ||
| Venture Density | ||
| Metro | Non-Metro | |
| (1) | (2) | |
| FCC Broadband Availability (%,2019) | 1.036 | 0.049 |
| (1.230) | (0.359) | |
| MS Broadband Usage (%,2019) | 2.418 | 0.960 |
| (2.302) | (1.429) | |
| ACS Broadband Subscription (% of population with fixed broadband subscription, 2018) | 2.228 | 0.391 |
| (2.941) | (1.127) | |
| M-Lab Broadband Use (% of testers with 25/3 Mbps speed, 2018-9) | -5.666** | 0.337 |
| (2.373) | (0.996) | |
| Agriculture (% of workers) | -7.925 | -1.162 |
| (5.606) | (1.770) | |
| Construction (% of workers) | 21.050** | 4.701 |
| (9.259) | (3.301) | |
| Wholesale (% of workers) | -12.213 | -2.828 |
| (20.179) | (8.097) | |
| Retail (% of workers) | 25.938** | -3.299 |
| (11.212) | (3.208) | |
| Transportation (% of workers) | 10.667 | -2.433 |
| (10.503) | (3.849) | |
| IT (% of workers) | 55.454* | 17.911 |
| (29.121) | (13.366) | |
| Finance (% of workers) | -6.449 | 5.600 |
| (15.478) | (6.509) | |
| Professional (% of workers) | 1.243 | 8.358* |
| (11.236) | (4.790) | |
| Education, healthcare, social (% of workers) | -5.464 | 0.455 |
| (6.591) | (2.305) | |
| Other occupation (% of workers) | -5.632 | -9.580* |
| (15.824) | (5.282) | |
| Public sector (% of workers) | -13.966 | -0.784 |
| (8.599) | (3.036) | |
| Self-employed (%) | 13.368 | 2.860 |
| (12.361) | (3.303) | |
| Education Less than Highschool (%) | 6.801 | 2.932* |
| (4.481) | (1.674) | |
| Bachelors Degree (%) | 29.272** | 14.580*** |
| (11.408) | (3.562) | |
| Graduate Degree (%) | -5.960 | 6.333 |
| (13.904) | (5.097) | |
| Babyboomer | 35.136*** | 12.437*** |
| (10.400) | (4.056) | |
| GenX | 42.460*** | 17.854*** |
| (11.579) | (5.517) | |
| Millenials | 27.922*** | 2.568 |
| (8.513) | (3.592) | |
| Constant | -32.587*** | -9.044*** |
| (8.365) | (2.766) | |
| Observations | 81 | 167 |
| R2 | 0.824 | 0.495 |
| Adjusted R2 | 0.757 | 0.418 |
| Residual Std. Error | 1.232 (df = 58) | 1.037 (df = 144) |
| F Statistic | 12.314*** (df = 22; 58) | 6.428*** (df = 22; 144) |
| Note: | p<0.1; p<0.05; p<0.01 | |
Copyright © 2020 Jaewon Royce Choi, Technology & Information Policy Institute (TIPI). All rights reserved.